
Intel’s Elkhart Lake processors made a splash in the embedded PC world with their huge performance boost compared to their predecessors. I’ve already recorded my first impressions of Elkhart Lake here, and my official review is here. In this article I’ll present some new benchmarks for the Intel Pentium J6425, part of the Elkhart Lake product family.
Why is Elkhart Lake so much better than its predecessors?
There are 3 main factors that explain why the Elkhart Lake series of CPUs is so much faster and power-efficient than Gemini Lake / Gemini Lake Refresh, its immediate predecessors.
The more power efficient 10nm process
- About 35% more efficient at the same power compared to Intel 14++++.
The new Tremont core design, replacing the older Goldmont cores
- This is a more modern core design which can fully take advantage of the increased transistor density.
The much improved “Gen11” integrated GPU
- Intel claims it is twice as fast as the Gen9 iGPUs from previous CPUs.
- It includes new video encoders/decoders as well as an all-new 3D graphics engine.
Now, onto the benchmarks!
The Benchmarks
Devices:
The Pentium J6425 test system:
| CPU | Intel Pentium J6425 (4 cores, 1.8 GHz base, 3 GHz boost, 10W TDP) |
| RAM | 2×4 GB DDR4-3200 SODIMM |
| Storage | 64 GB mSATA, 32 GB MLC eMMC |
| GPU | Intel Gen11 (32 EUs) |
Google Octane 2.0

Google Octane is a browser-based speed test which measures JavaScript performance with a number of different workloads. Generally, browser benchmarks are a good overall indicator of single-core speed, and Google Octane is no exception. Please note that Google Octane 2.0 is retired and no longer maintained. Also: AnandTech maintains a database of benchmark scores, including Google Octane scores for more than 100 different CPUs.
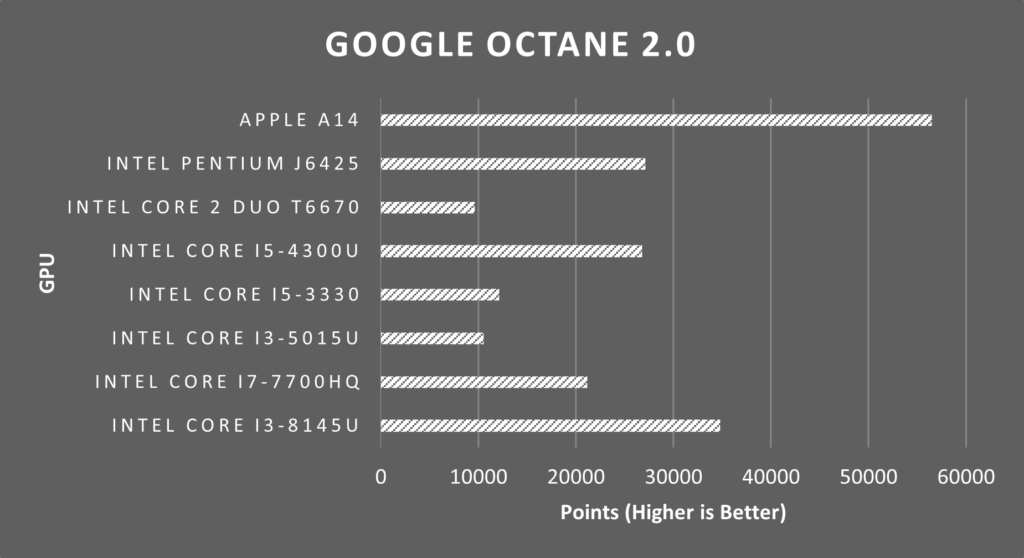
For an interesting comparison, I included the Apple A14 in these charts. (It’s the processor found in the iPhone 12 family of smartphones). It (unsurprisingly) beats out all the other CPUs, most likely due to its tight integration with iOS. Note: I tried running Octane on both Safari, Firefox, and Firefox Focus for the A14 and got similar results each time.
Apart from that, there are only a few surprises in this benchmark. For one, the Pentium J6425 only managed to score 27116 points, slower than the Intel i3-8145U, which is a Skylake-based processor. Of course, there is a lot of variability in these results, due to the different browsers, (Chrome and Firefox were used on different systems), and different operating system versions.
Speedometer 2.0

Speedometer 2.0 is another browser benchmarks which also serves to mainly measure single-core performance.
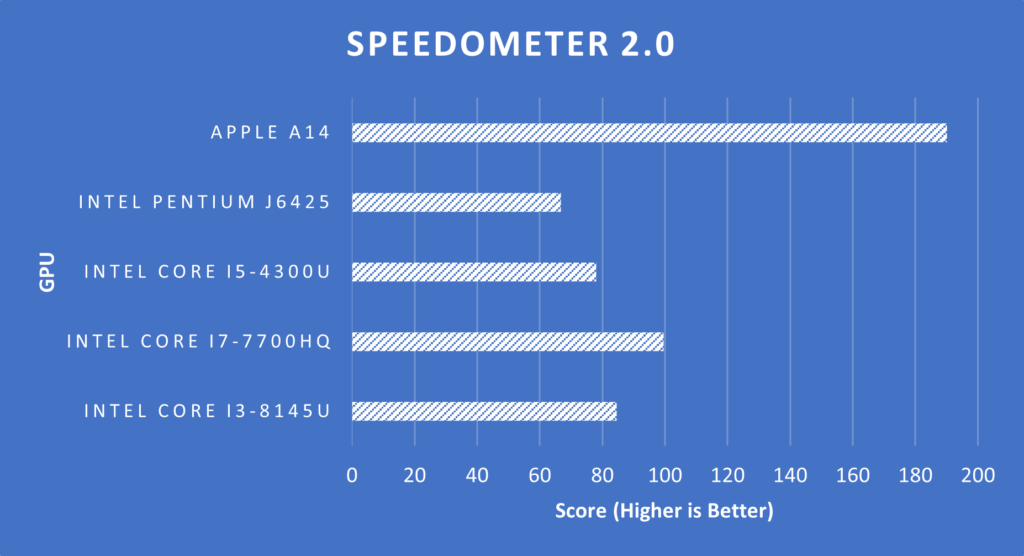
Speedometer is a browser benchmark that measures the responsiveness of Web applications. It uses demo web applications to simulate user actions such as adding to-do items.
BrowserBench
Once again, the A14 blows away these other Intel CPUs. However, the Pentium J6425 is not designed for web applications like many consumer CPUs may be; rather, it is at home in embedded situations, sipping power while, say, running an ML model. This is apparent from its rather low base clock speed.
Cinebench R23

Next up we have the infamous Cinebench R23, which has polarized the PC community. Is it a great indicator of performance? Or is it a cherry-picked benchmark in a contrived, artificial scenario? I’ll leave that for you to decide. Nonetheless, Cinebench offers a reasonable guess as to the relative single and multi-core speed of a CPU relative to other CPUs.


As we saw before, the Pentium J6425 doesn’t compete with consumer CPUs, even consumer CPUs from five years ago, on single-core performance. The processors which are allowed to stretch their legs with higher-wattage boost profiles can have extended boost periods, allowing them to complete this relatively long benchmark faster.
On the other hand, the J6425 is very competitive in the parallel front. With 4 cores and 4 threads (no hyper-threading), this processor is much improved over the i5-4300U(a dual-core with hyper-threading), or the 8145U(with a Skylake-based architecture). It is competitive with the Intel Core i5-3330, an older quad-core that does not have hyper-threading, just like the J6425. However, the 3330 has a much higher TDP(Over 5x higher) than the J6425 with Atom cores.
7-Zip

7-Zip is one of the most popular file archivers in the world. It is completely open-source and also works as a file explorer. 7-Zip actually has a built-in benchmark that measures compression speed. This can often be sped up by accelerators inside the CPU for this very purpose.
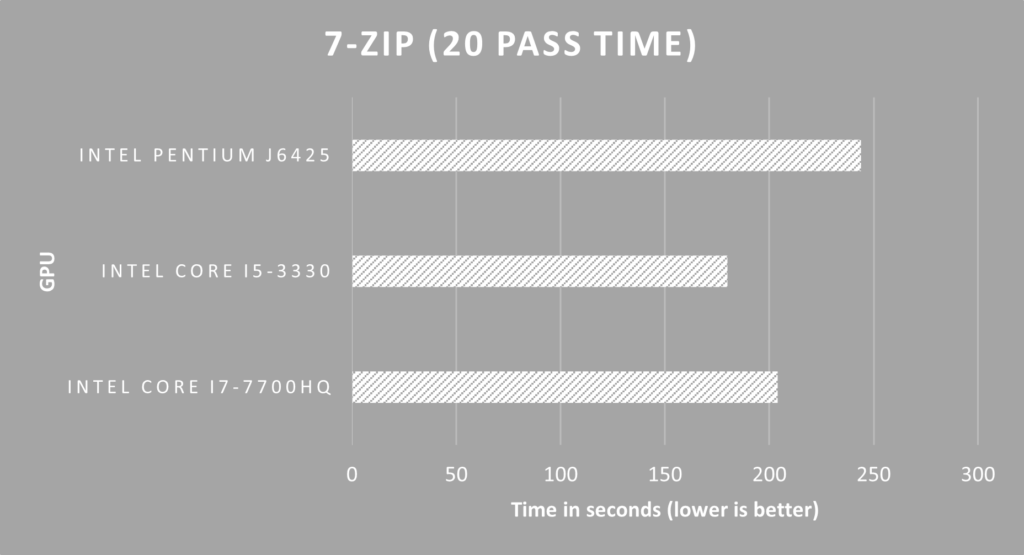
For this benchmark I measured the time it took for 20 passes of the benchmark to complete. We see that the J6425 performs the worst out of this group. While it is hard to pinpoint an exact cause, I believe this is because of the J6425’s very conservative boost characteristics. The i5-3330 and i7-7700HQ both have high TDPs and even higher PL2’s, allowing them to consume tremendous amounts of power for short bursts.
Basemark GPU

Unlike the other benchmarks in this compilation, Basemark GPU, is a GPU benchmark! It renders a short, 2-minute scene, using different graphics APIs and settings, and returns the minimum, average, and maximum framerate. For this benchmark I will just be using the “score” number the benchmark generates.
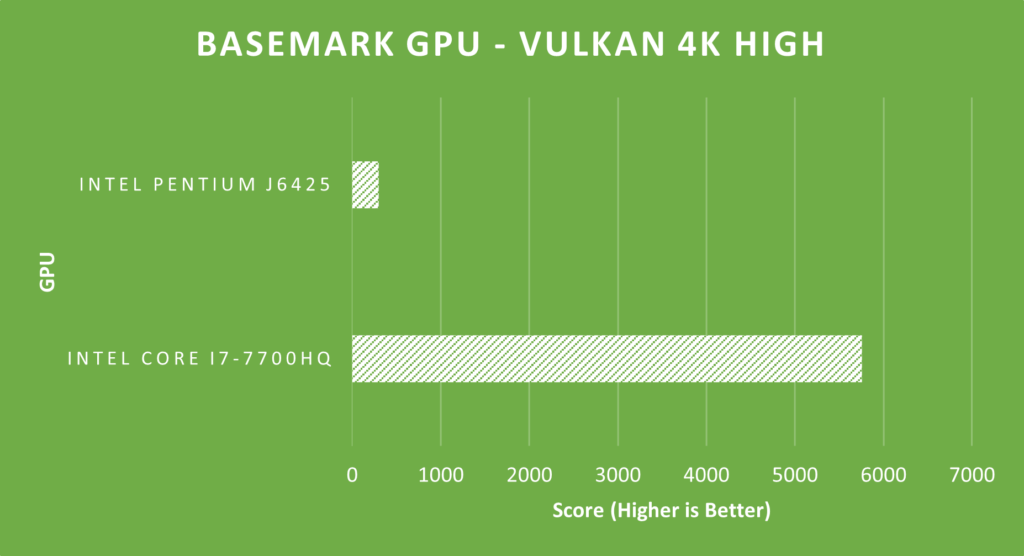
Unfortunately, I do not have a lot of comparison data for this benchmark. I will work to get these charts updated soon. However, at 4K resolution, with the Vulkan API, and High settings, the J6425 scores 301 points. This is, of course, paltry compared to the score of a GTX 1070 (5758 points). However, the J6425’s integrated GPU is a great step up over its predecessors, as it uses a newer Gen11 GPU and has more EUs (32 of them, to be precise).
Conclusion
Why are you looking here? Check out the conclusion of my offical Intel Elkhart Lake Review! In all seriousness, though, these new benchmarks provide some interesting data to reinforce what we already know about this CPU. Since it has a low TDP, it does not do well in single-core applications. However, for more parallelized applications such as deep learning or data processing, the J6425 will be a great improvement over an older processor like the J3455.


